
Introduction to Graphing and Equations in Two Variables
Abstract
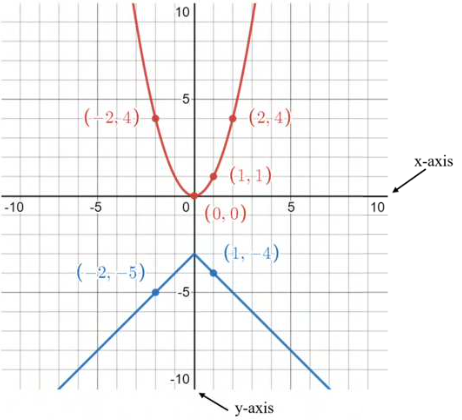
This activity introduces equations in two variables. Data values are presented in xy-tables, and graphs -- both linear and nonlinear -- are used to introduce students to the coordinate plane, ordered pairs, and graphs. Characteristics and vocabulary such as intercepts, origin, and quadrants are introduced. In addition, the activity covers how to determine if an ordered pair is a solution to a two-variable equation, finding the intercepts of a two-variable equation, and using the intercepts to graph a linear equation.
Level: Undergraduate
Setting: Classroom
Activity Type: Learning Cycle
Discipline: Mathematics
Course: College Algebra
Keywords: Graphing, Functions
Downloads
Published
2022-02-14
How to Cite
Heffernan, K. (2022). Introduction to Graphing and Equations in Two Variables. POGIL Activity Clearinghouse, 3(1). Retrieved from https://pac.pogil.org/index.php/pac/article/view/222
Issue
Section
Activities for Testing
License
Copyright of this work and the permissions granted to users of the PAC are defined in the PAC Activity User License.
