
Pipeline Diagrams and Pipeline Timing
Computer Architecture
Abstract
This activity was designed for use in a Computer Architecture course that incorporate the MIPS datapath. However, it could be used for any course that introduces pipelining, with slight modifications. In this activity, students will learn how to draw pipeline diagrams to map the stages of execution for a set of MIPS instructions. Students will also create a formula to determine the number of cycles it takes to complete a set of instructions in a pipeline without hazards.
After completing this activity, students should be able to:
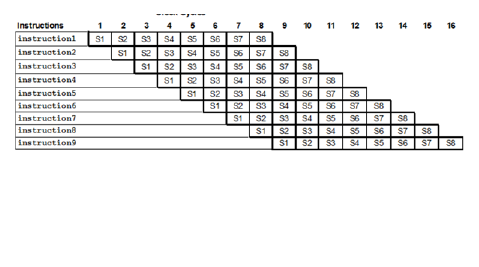
- Explain each part of a pipeline diagram.
- Use a pipeline diagram to determine how many cycles are necessary to complete a set of LW instructions.
- Apply a formula to determine the number of cycles required to complete any number of instructions in a pipeline.
This activity was developed with NSF support through IUSE-1626765. You may request access to this activity via the following link: IntroCS-POGIL Activity Writing Program.
Level: Undergraduate
Setting: Classroom
Activity Type: Learning Cycle
Discipline: Computer Science
Courses: Computer Architecture
Keywords: pipeline, MIPS pipeline, CPU pipeline, pipeline clock cycles, pipeline timing, pipeline diagrams
Downloads
Published
How to Cite
Issue
Section
License
Copyright of this work and the permissions granted to users of the PAC are defined in the PAC Activity User License.
