
Z-Scores
Abstract
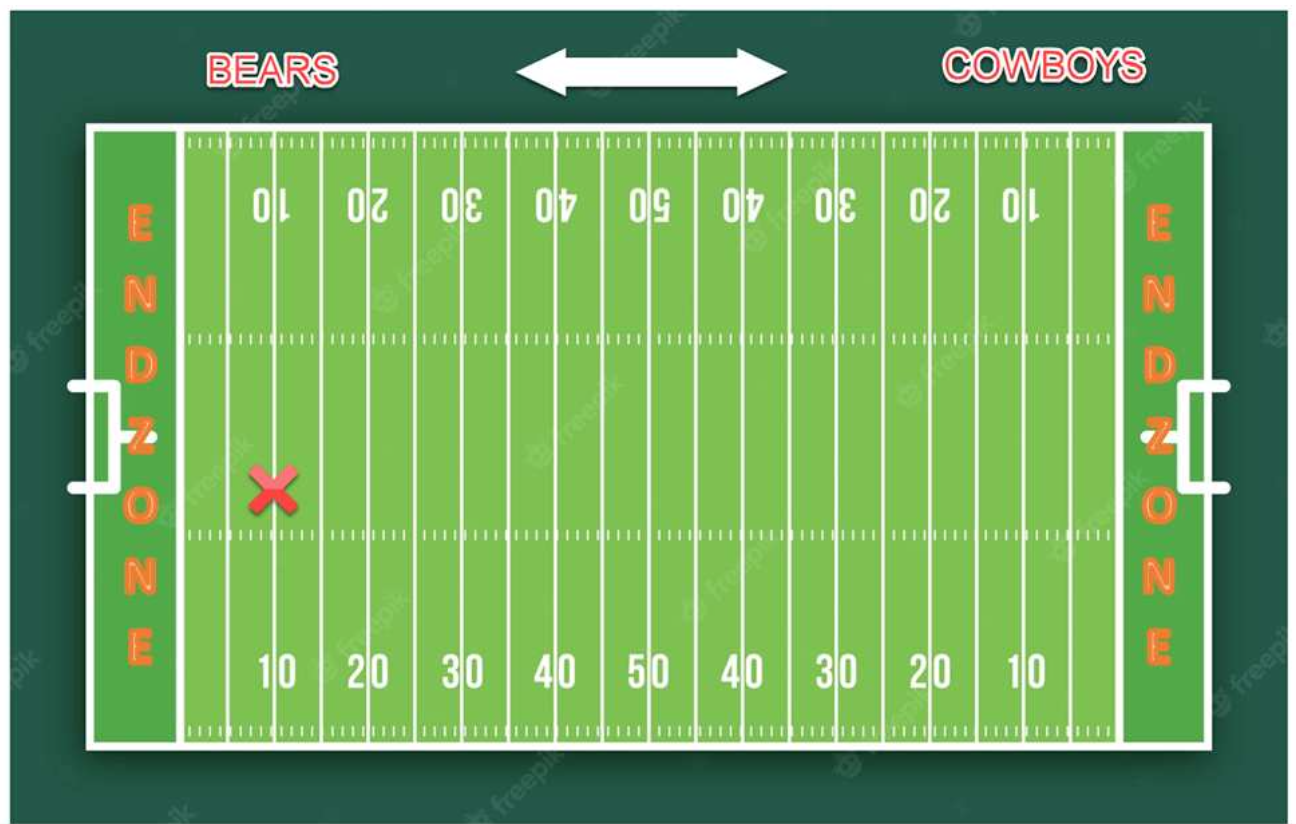
This activity is meant to introduce students to z-scores, which is one of the steps in learning statistics, probability, and data analysis. Students will learn the association between percentages under the Normal Distribution curve and z-scores, how to calculate z-scores, as well as how to interpret individual performance levels based on z-scores. The activity eases students into the understanding of z-scores by first drawing an analogy between area on a football field and the area under the Normal Distribution curve.
Level: High School, Undergraduate, Graduate
Setting: Classroom or Laboratory
Activity Type: Learning Cycle
Discipline: Psychology
Course: Research Methods and Statistics
Keywords: Z-score, Normal Distribution, Bell Curve, percentile
Downloads
Published
How to Cite
Issue
Section
License
Copyright (c) 2024 Yelena PolyashukCopyright of this work and the permissions granted to users of the PAC are defined in the PAC Activity User License.
