
Using Data Tables and Graphs
Abstract
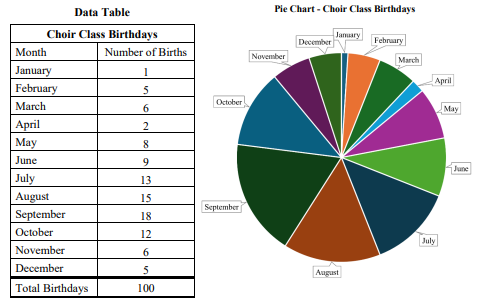
This activity is meant to apply across science class disciplines as a review/refresher for students with low fluency in data table and graph production. The models explore the timing of birthdays and compare birth rates in selected countries. Learning objectives include describing the advantages of various forms of data display, choosing the appropriate type of graph for a particular data set, and identifying the arrangement of variables in data tables. Key words: high school, classroom, Learning Cycle, science, data tables, graphs.
Level: High School
Setting: Classroom
Activity Type: Learning Cycle
Discipline: Any science
Course: Any science
Keywords: data tables, graphs
Downloads
Published
How to Cite
Issue
Section
License
Copyright (c) 2026 Susan Richardson, Rick MoogCopyright of this work and the permissions granted to users of the PAC are defined in the PAC Activity User License.