
Describing and Summarizing Histograms
Abstract
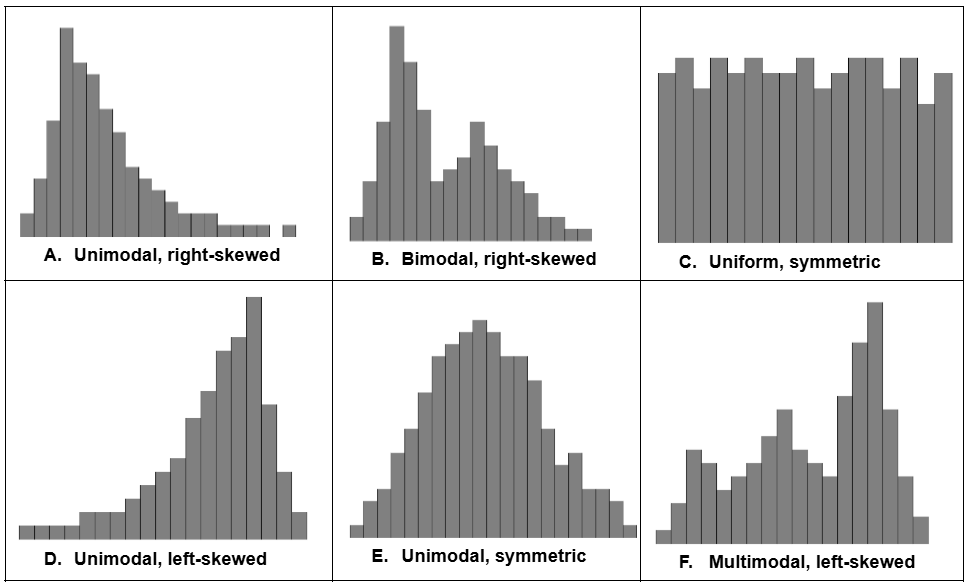
This is an activity for an introductory statistics course about conclusions about a dataset that can be drawn based on a histogram. The focus is on vocabulary for describing histogram shape, as well as the relationship between measures of central tendency and the shape of the data. This activity fits best as part of a study of descriptive statistics.
Level: High School, Undergraduate
Setting: Classroom
Activity Type: Learning Cycle
Discipline: Statistics
Course: Introductory Statistics
Keywords: histogram, skew, modality, central tendency, mean, median
Downloads
Published
2026-07-17
How to Cite
Oehrlein, J. (2026). Describing and Summarizing Histograms. POGIL Activity Clearinghouse, 7(1). Retrieved from https://pac.pogil.org/index.php/pac/article/view/568
Issue
Section
Activities for Testing
License
Copyright (c) 2026 Jessie OehrleinCopyright of this work and the permissions granted to users of the PAC are defined in the PAC Activity User License.